

An economic cycle is measured from the end of the last recession to the beginning of the next one. Since World War Two, the average expansion period of the cycle, from the bottom of last cycle to peak growth has lasted 58 months. The current cycle began in June 2009, and at 107 months is the second longest cycle on record.
We believe there are a number of indications, such as the recent flattening of the yield curve, that suggests we may be nearing the end of the cycle, and thus approaching the next recession.
The difference in yield between the 10-year U.S. Treasury Bond and the 1-year Treasury note (the “yield spread”) has been flattening and stood at .71% on May 21, 2018 (first graph below) .
A yield spread larger than 1% is normal and is considered as a green light for a growing economy. A yield spread lower than 1% can be thought of as a yellow light signaling caution as the economy may be slowing. A Yield spread lower than 0 is considered an “inverted yield curve” and is a red light signaling recession ahead. Since 1955, 9 out of 10 recessions were signaled by an inverted yield curve. Some Wall Street commentators have suggested that the flattening yield curve today may be partially due to the historically low level of interest rates, and not necessarily indicative of a slowing economy. This issue is addressed in the attached report from the San Francisco Federal Reserve Bank which found it is not substantiated by statistical analysis.
One asset class that tends to perform well at the end of the economic cycle, even after the stock market begins to correct, are commodities. On a historic basis, commodities appear to be very cheap vs the stock market. The second graph below shows the relative value of commodities, as represented by the Goldman Sachs Commodity Index (GSCI) vs the S&P 500.
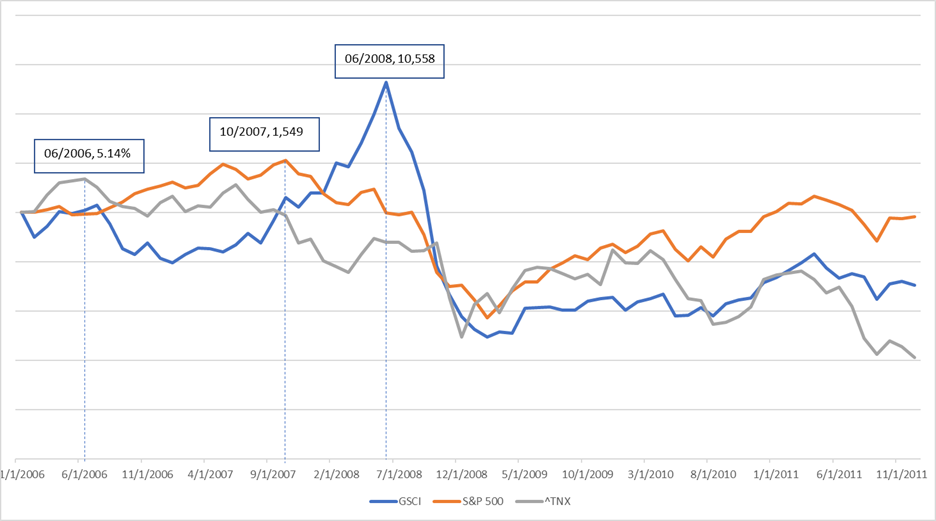
The 3rd graph shows that the yield on the 10-year U.S. Treasury bond (TNX) peaked in June 2006 and remained about the same for a year. The S&P 500 peaked in October 2007. Nine months later, commodities (GSCI) peaked in June 2008, just before the Financial Crisis hit its apex with the collapse of Lehman Brothers on Sept 15, 2008. There is no guarantee that this will play out again but it does bare watching.
We advise caution be taken with stock allocations and suggest a lower than normal allocation be considered. We continue to evaluate the data to determine whether an investment in commodities is warranted at this time.
Stay tuned.
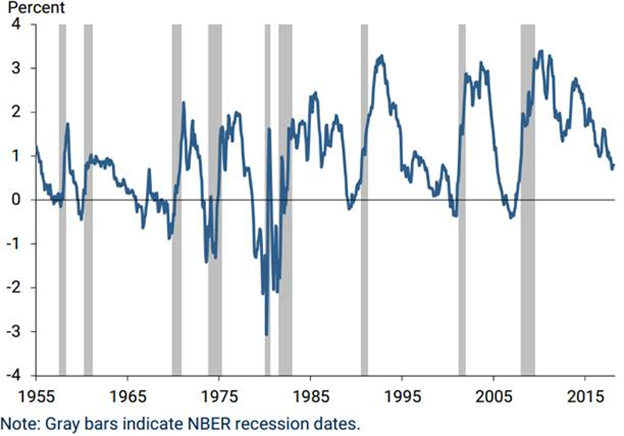
Treasury yield spread, 10 year yield – 1 year yield.
(Source: Federal Reserve Bank of San Francisco, Economic Letter, Michael D. Bauer and Thomas M. Mertens, March 5, 2018 )
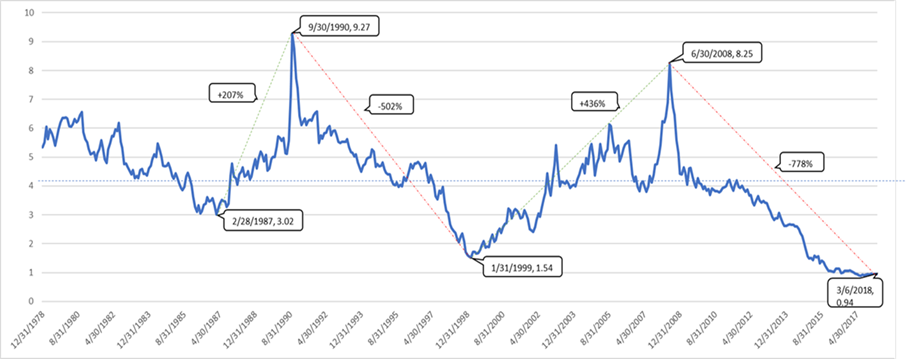
Mean of the GSCI/ S&P 500 ratio = 4.11 for the last 30 years. Commodity is comparatively undervalued compared to S&P 500.
(Source: Yahoo Finance and Zephyr StyleAdvisor )
‘One asset class that tends to perform well at the end of the economic cycle, even after the stock market begins to correct, are commodities’
GSCI=Goldman Sachs commodity index
S&P 500= S&P 500 US Stock Index
TNX= Yield on 10 year US Treasury Bond
(Source: Yahoo Finance and Zephyr StyleAdvisor )